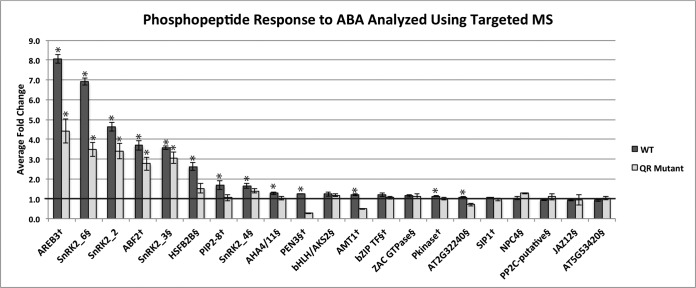
Fig. 4.
Comparison of ABA-responsive phosphorylation changes in WT and pyr1/pyl1/pyl2/pyl4 (QR) mutant analyzed using targeted MS. Phosphopeptides from the dataset presented here are designated with §, and phosphopeptides from previously published discovery work (Kline et al., 2010) (17) are designated with †. Bars are marked (*) to indicate p ≤ .05. See Table S3 for p values.

