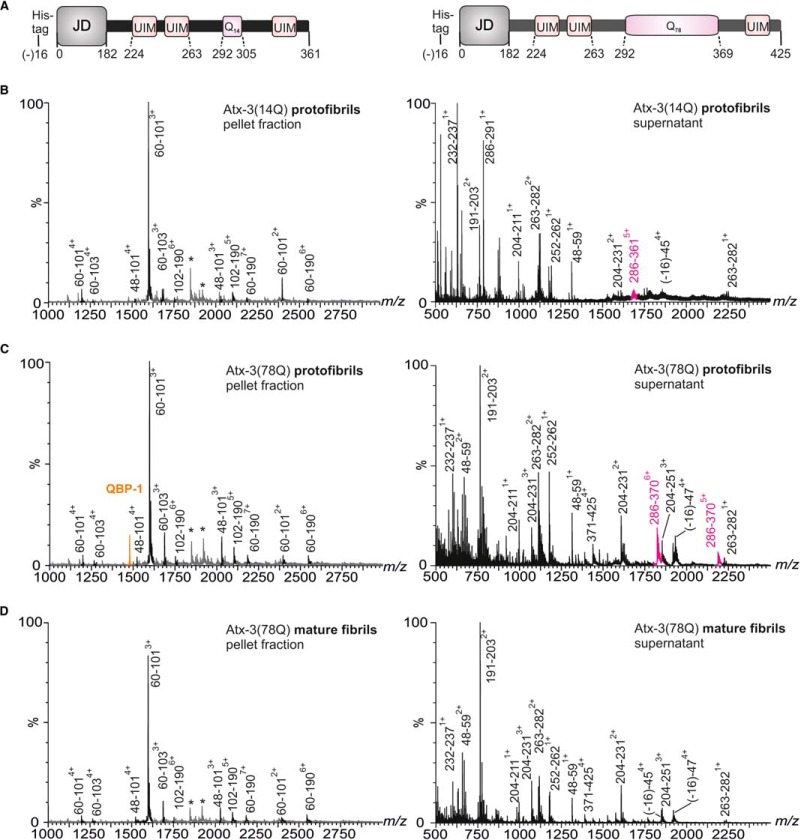
Fig. 2.
Limited proteolysis of protofibrils and mature fibrils. (A) Schematic illustrations of atx-3(14Q) (left) and atx-3(78Q) (right) with amino acid residue numbers for each domain shown. Mass spectra obtained following limited proteolysis with trypsin of (B) atx-3(14Q) protofibrils (C) atx-3(78Q) protofibrils and (D) atx-3(78Q) mature fibrils. Mass spectra of (left) the depolymerized fibrillar material are contrasted with those obtained from analysis of (right) the soluble products of proteolysis. Asterisks represent species observed in the pellet fraction that were also observed in supernatant samples ((-16)-454+ and (-16)-474+, respectively). Peaks identified as containing the polyQ tract are highlighted in pink, while those representing QBP-1 are highlighted in orange.

