
Fig. 7.
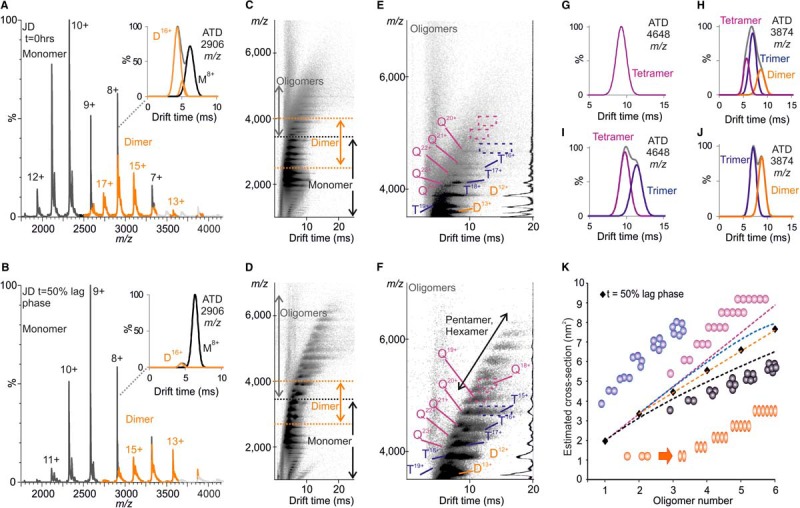
JD oligomerization. ESI-IMS-MS data obtained upon analysis of the JD (top) before aggregation (t = 0 h) and (bottom) at 50% through the lag phase of aggregation (∼8 h), as monitored by ThT fluorescence. (A, B) Representative ESI mass spectra with insets showing extracted ATDs for the m/z 2906 ion species. Monomer (black), D = dimer (orange). (C, D) Driftscope plots of (A) and (B), respectively. (E, F) Driftscope plots showing the oligomeric species in (C) and (D), respectively with MS spectra inset, T = trimer (blue) and Q = tetramer (purple). Dashed boxes highlight trimeric and tetrameric species (E, inset) absent at 0 h incubation and (F, inset) present at 50% through the lag phase of aggregation. Extracted ATDs for (G, I) the m/z 4648 ion species and (H, J) the m/z 3874 ion species at 0 h and 50% of the lag phase, respectively. (K) Oligomers increase in CCS with oligomer number in a linear fashion. Experimentally derived CCSs (black diamonds). Various models of oligomer assembly are shown: ring (blue), linear (purple), isotropic (black), and linear after dimerization (orange). The data best fit a model of linear assembly after dimerization (orange dashed line).