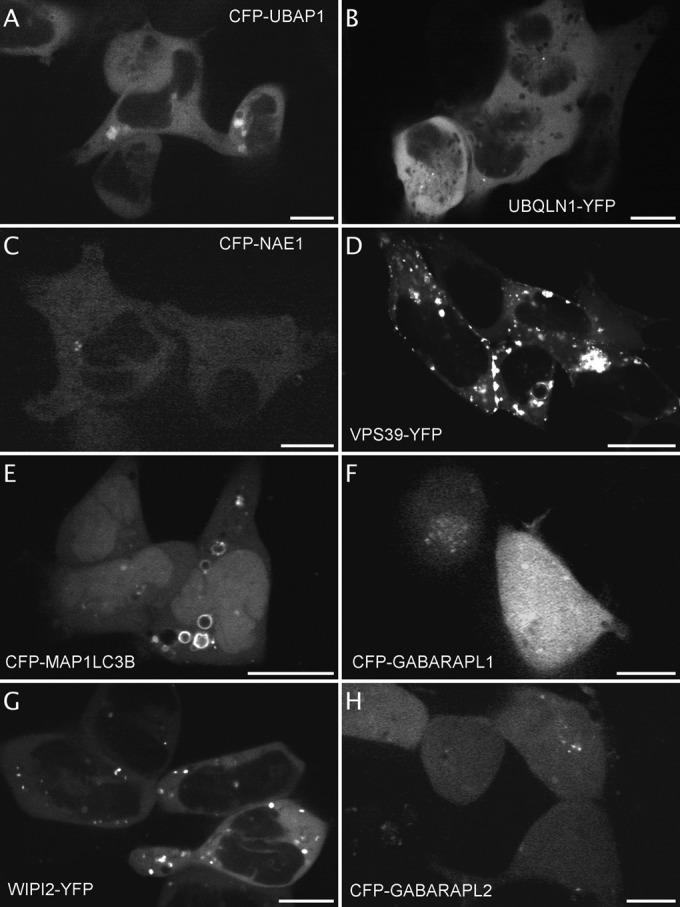
Fig. 2.

Correct detection in HEK-NK2R of fluorescent proteins implicated in internalization and in autophagy during the screen as blind internal controls. A, The image of cells expressing CFP-UBAP1 in the cytoplasm and around large vesicular structures is extracted from video1 (out of 2 videos on the website). Five cells out of eight are displayed. B, The image of cells expressing UBQLN1-YFP in the cytoplasm and few spots are extracted from video2. Four cells out of five are displayed. C, The image of cells expressing CFP-NAE1 in the cytoplasm and dots is extracted from video1 on the website. Two cells can be visualized out of six in the video. D, The image of cells expressing VPS39-YFP in the cytoplasm and aggregates is extracted from video1 on the website. Four cells out of eight are displayed. E, The image of cells expressing CFP-MAP1LC3B in the cytoplasm, around vacuole-type compartments and enriched in the nucleus is extracted from video 1 out of four videos. Three cells out of four are displayed. F, The image of cells expressing CFP-GABARAPL1 in the cytoplasm, dots and the nucleus is extracted from video 1 out of three videos. Two cells out of nine are displayed. G, The image of cells expressing WIPI2-YFP in the cytoplasm and vesicles is extracted from video1 out of four videos. Five cells out of eight are displayed. H, The image of cells expressing CFP-GABARAPL2 in the cytoplasm, dots and nucleus is extracted from video 1 out of four videos. Five cells out of seven are displayed. Scale bar 5 μm.
