
Fig. 3.
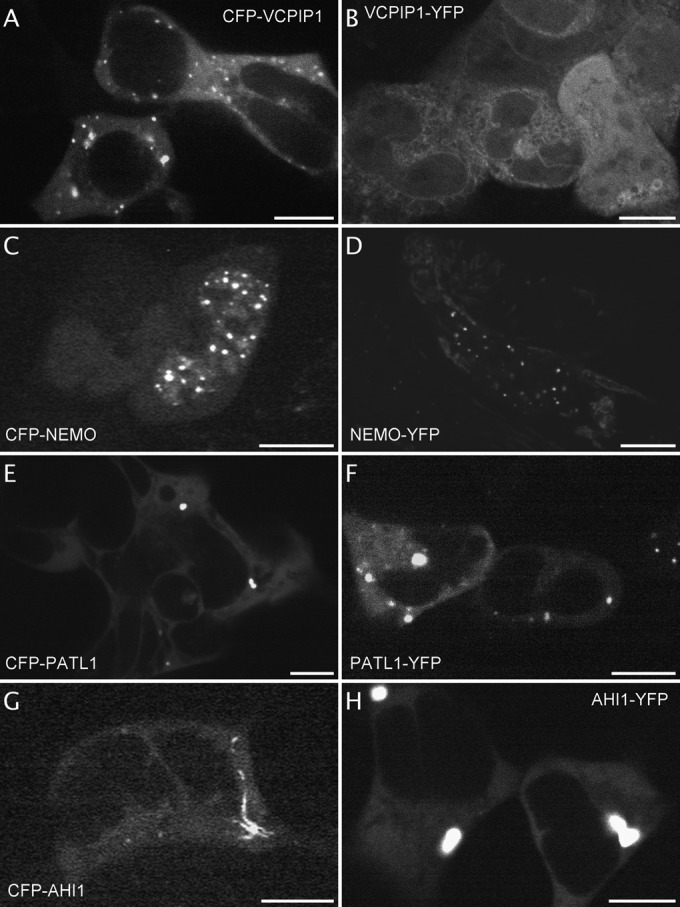
Identification of variation of localization depending on the fluorophore orientation in the fusion protein expressed in HEK-NK2R cells. Images extracted from the videos of VCPIP1 expressing cells with the fluorophore fused to its Nter (A, extracted from video 1 out of two, 3 cells displayed out of 10) or to its Cter (B, extracted from video 7 out of seven, 6 cells displayed out of 21). Images extracted from the videos of NEMO expressing cells with the fluorophore fused to its Nter (C, from video1 out of two, 3 cells displayed out of 6) or to its Cter (D, from video 1, 2 cells displayed out of 8). Images extracted from the videos of PATL1 expressing cells with the fluorophore fused to its Nter (E, from video 2, 6 cells displayed out of 8) or to its Cter (F, from video 3 out of five, 2 cells displayed out of 13). Images extracted from the videos of AHI1-expressing cells with the fluorophore fused to its Nter (G, from video 3, 1 cell displayed out of 14) or to its Cter (H, from video 1 out of 3, 2 cells displayed out of 13). Scale bar 5 μm.