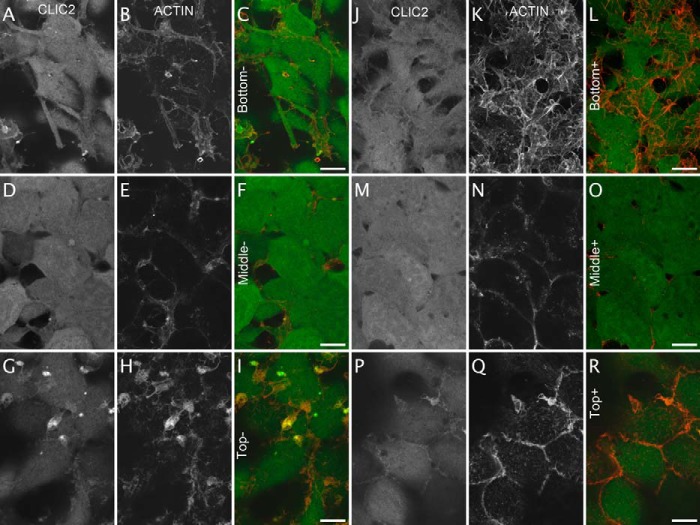
Fig. 8.
Co-localization of CLIC2-mYFP with actin. Confocal imaging of CLIC2-mYFP cells before (A to I) and 1 h after agonist challenge (10 μm carbachol, J to R). Cells were fixed and stained with Texas-Red phalloidin. Z-stack images of the cells were collected from the bottom (A, B, C, J, K, L), the middle (D, E, F, M, N, O) and the top of the cells (G, H, I, P, Q, R). The CLIC2-mYFP signal is in (A, D, G, J, M, P). The actin is visualized in (B, E, H, K, N, Q). Co-localized YFP (in green) and Texas-Red (in red) signals appear yellow in the overlay (C, F, I, L, O, R). n = 2 independent experiments. Scale bar 5 μm.

