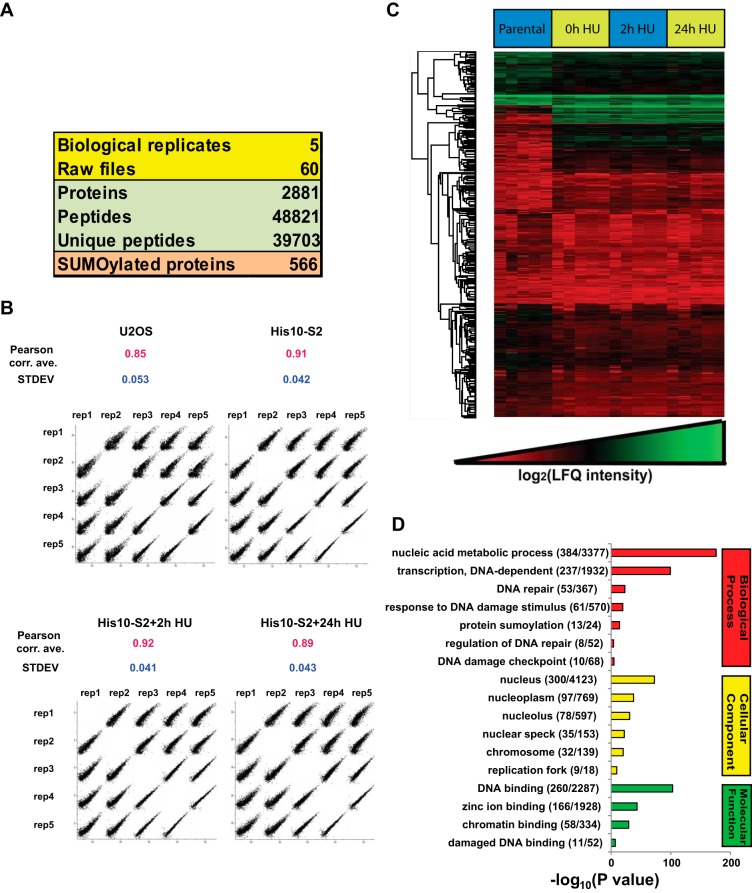
Fig. 5.
Overview of the SUMO proteomics results. A, Overview of the proteomic experiments. Out of 2,881 proteins identified with 48,821 peptides, 566 proteins were considered as SUMO-2 target proteins after filtering by LFQ intensities as described in Fig. 4. B, LFQ intensity scatter plot. Each condition of each biological replicate was plotted together to visualize the correlation between the experiments. Pearson correlation averages were calculated for each condition and standard deviations (S.D.) are indicated. C, Heat map of log2 LFQ intensities. Hierarchical clustering was performed for all identified proteins. Within each biological replicate, the sample order from left to right was U2OS, U2OS His10-SUMO-2 (mock treated), U2OS His10-SUMO-2 (2 h HU), and U2OS His10-SUMO-2 (24 h HU). D, GO term enrichment analysis of the SUMOylated proteins identified. The bar chart shows GO terms for biological processes, cellular components and molecular functions.

