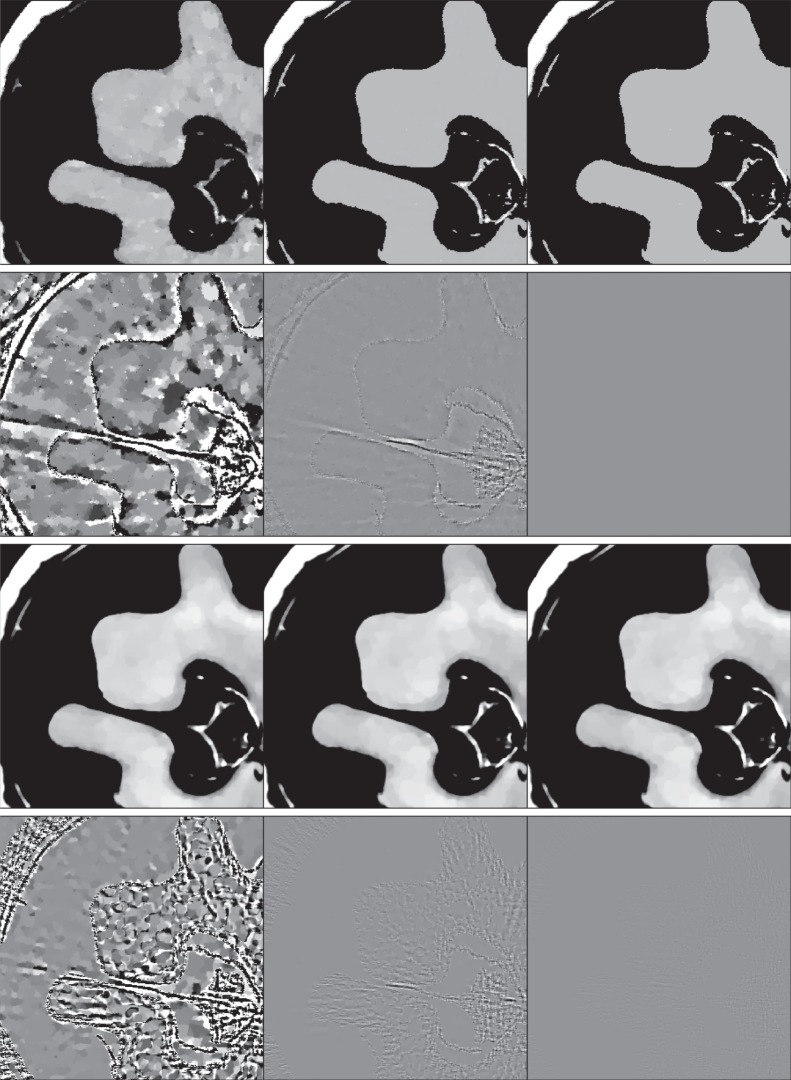
Figure 13.
First row: reconstructed images from data generated by the structure walnut with 40 (left), 60 (middle) and 68 (right) projection views (grey scale window [0.3,0.4] cm−1). Second row: same as first row except the structure walnut image is subtracted from the reconstructed images (grey scale window [−0.01,0.01] cm−1). Third row: reconstructed images from data generated by the texture walnut with 80 (left), 120 (middle) and 160 (right) projection views (grey scale window [0.3,0.4] cm−1). Fourth row: same as third row except the texture walnut image is subtracted from the reconstructed images (grey scale window [−0.001,0.001] cm−1).

