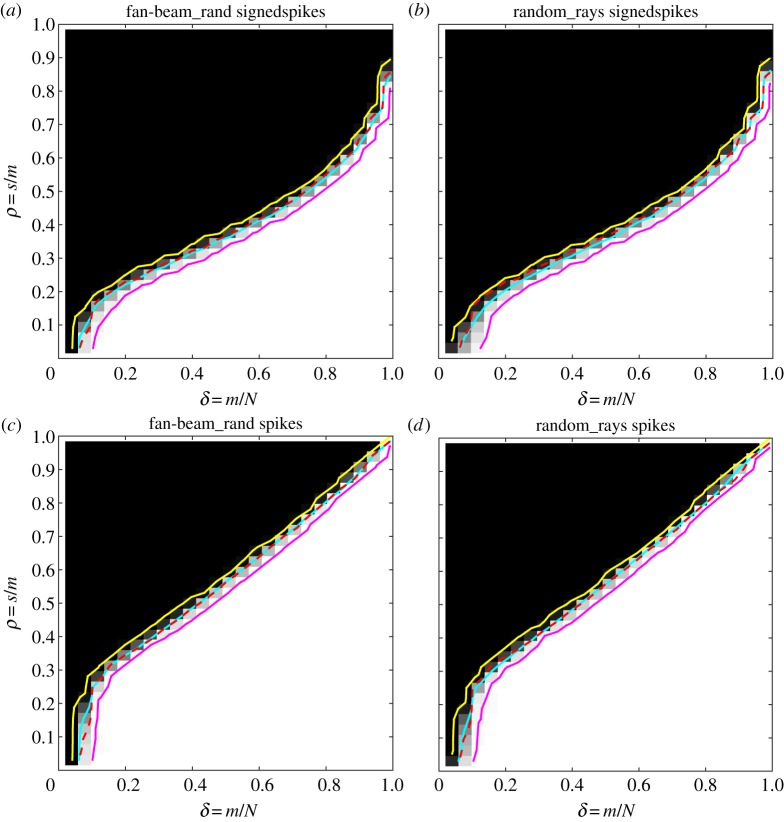
Figure 6.
DT phase diagrams. Signedspikes image class and P1 reconstruction (a,b) and spikes image class and LP reconstruction (c,d). Fan-beam with random source positions (a,c) and random rays geometry (b,d). Empirical phase-transition curve for equi-angular fan-beam CT (dashed red), empirical phase-transition curve at 50% contour line (cyan), and 5% and 95% contour lines (yellow and magenta).

