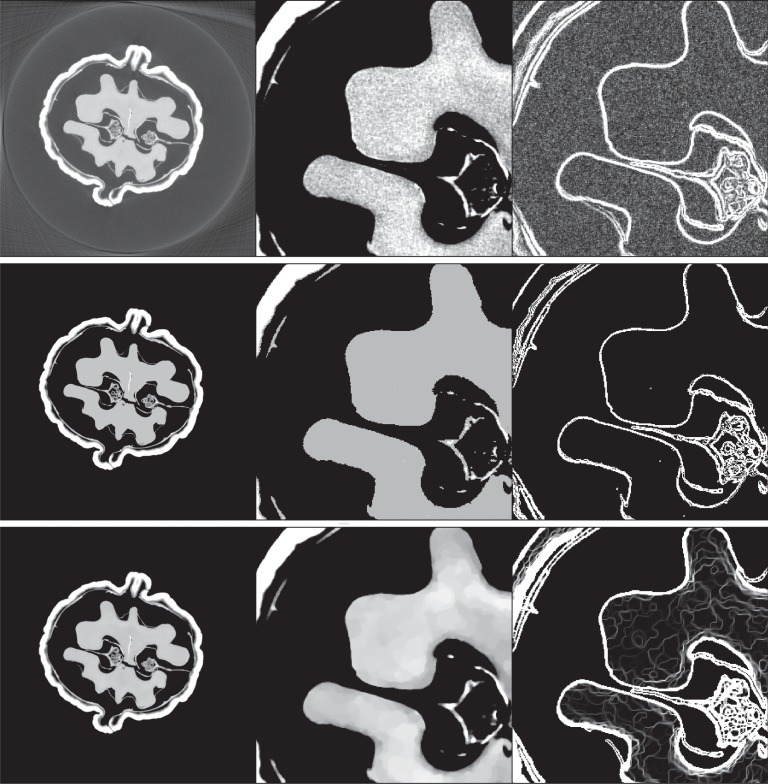
Figure 8.
(Top row) Tomographic slice of a walnut, (middle row) structure phantom derived from the walnut slice image and (bottom row) texture phantom also derived from this image. The left column shows the whole image in the grey scale window of [0,0.5] cm−1, except for the original walnut image where it is [−0.1,0.5] cm−1. The middle column shows a blown-up region of interest in the narrower grey scale window [0.3,0.4] cm−1 in order to see the texture on the walnut meat. The right column illustrates the gradient-magnitude image in the grey scale window [0,0.01] cm−1, except for the original walnut image where it is [0,0.05] cm−1.

