Figure 9.

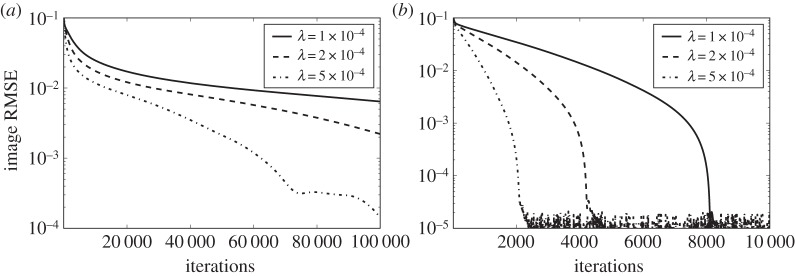
Image RMSE curves resulting from algorithm 1 run with different values of λ for Nv=21 and data generated from the Nside=128 version of the structure walnut phantom. Results for P1 and TV are shown on (a) and (b), respectively.

Image RMSE curves resulting from algorithm 1 run with different values of λ for Nv=21 and data generated from the Nside=128 version of the structure walnut phantom. Results for P1 and TV are shown on (a) and (b), respectively.