
Figure 8.
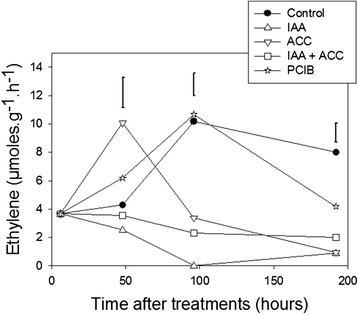
Variations in ethylene production after the hormonal treatments (see abbreviations in legend of Figure 2). n = 3 biological replicates, error bars are LSD at the 0.05 level.
Official websites use .gov
A
.gov website belongs to an official
government organization in the United States.
Secure .gov websites use HTTPS
A lock (
) or https:// means you've safely
connected to the .gov website. Share sensitive
information only on official, secure websites.
Variations in ethylene production after the hormonal treatments (see abbreviations in legend of Figure 2). n = 3 biological replicates, error bars are LSD at the 0.05 level.