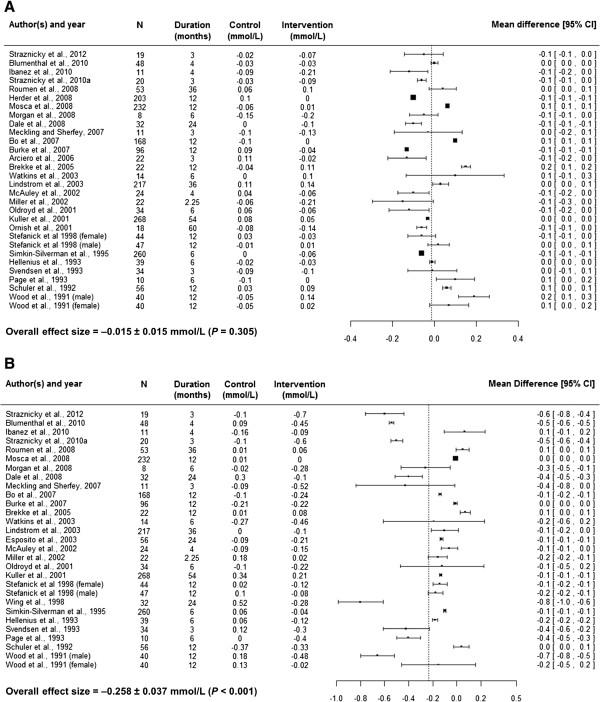
Figure 4.

Forest plots showing absolute high density lipoprotein (A) and triacylglyceride (B) changes (from baseline) in control and intervention arms, average sample size (N) across both arms, time duration related to the changes and mean difference of changes with its confidence interval (95% CI).
