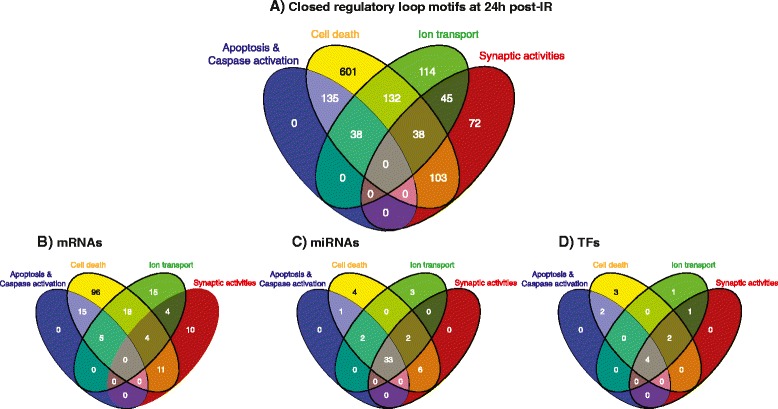
Figure 5.

Venn diagrams representing the relative contribution of cellular processes and the numbers of their unique and overlapping loop motifs and molecular components at 24 h. A. The numbers of common and unique loops-motifs associated with 4 different cellular processes. B. The common and unique mRNAs associated with 4 different cellular processes. C. The common and unique miRNAs associated with 4 cellular processes. D. The common and unique TFs associated with 4 cellular processes. The 4 colored oval shapes represent different biological processes. Blue: apoptosis and caspase activation, yellow: cell death, green: ion transport, red: synaptic activity.
