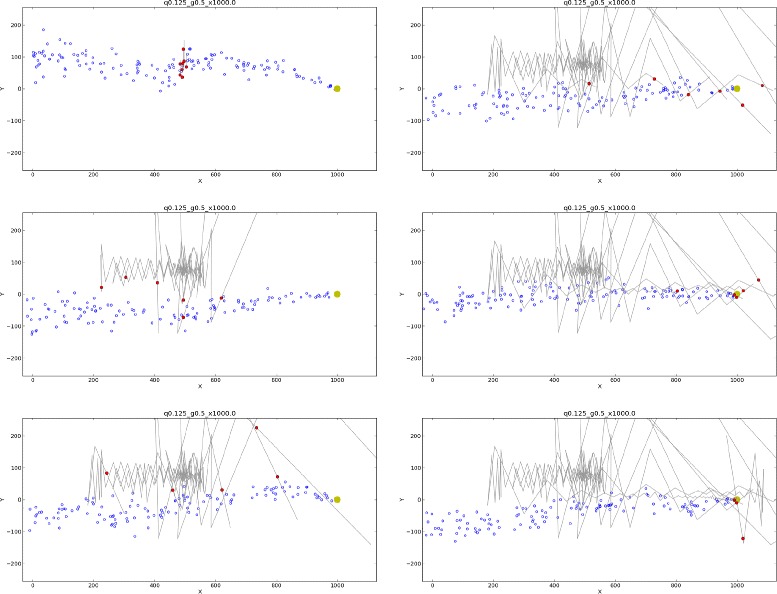
Figure 4.

Sample trajectories of simulated male moths seeking a pheromone source. Graphics represent intervals of 250 nondimensional time units, beginning after the initial encounters of 8 moths (τ=2.5, P cross=0.25, , V=1.15) with a simulated plume (Q=0.125, r gust=0.05, U gust=0.5, r puff=r source=10). Red circles represent current moth positions; gray lines represent flight tracks, including the current transit. The plume source is located at x=1000, y=0. The widely divergent trajectories reflect strong dependence on the location and number of puffs encountered in the initial transit across the pheromone plume, at downstream position x=500. In this simulation, the plume of pheromone puffs (blue circles) has been transported by gusts in the positive y-direction at the time of encounter. Shortly afterwards, the wind shifts towards the negative y-direction, leaving simulated moths well outside the plume. Depending on the level of certainty they attained before the wind shift, moths either advance slowly upwind or begin “casting” while drifting downwind. Upon regaining contact with the plume, moths resume upwind advance. The sequence of images shows several moths “overshooting” the source while undertaking large lateral and upwind excursions; other moths locate and track the plume centerline more closely, and consequently move more directly towards the source. One overshooting moth is shown to revert to casting behavior in response to detecting loss of the plume. At the last time shown, this moth is on a trajectory leading to the source during a sequence of downwind movements.
