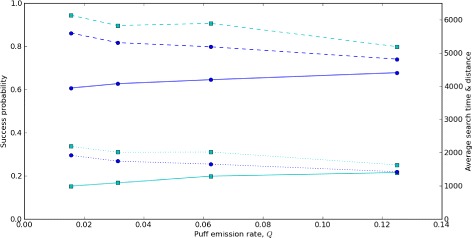
Figure 5.

Variation of moth odor source location performance with pheromone puff emmission rate. The lines represent three performance metrics for source location by simulated moths for two different gust rates (blue circles: r gust=0.05; cyan squares: r gust=0.0125) across a range of puff emission rates (Q=[0.015625,0.03125,0.0625,0.125]). Lower r gust corresponds to more persistent gusts, and hence larger lateral plume displacements. Moth behavior parameters are as in Figure 4. Solid lines represent search success probability, P success – that is, the fraction of moths arriving at the source within a fixed simulated time interval (left axis). Dashed lines represent E time, a time-based efficiency metric for successful moths, i.e., the straightline flight time from the moth’s starting point to the source, divided by the actual travel time (right axis). Dotted lines represent E distance, a distance-based efficiency metric for successful moths, i.e., the straightline distance from the moth’s starting point to the source, divided by the actual distance traveled (right axis). Of the three metrics, only P success varies strongly between gust conditions; the effects on E time and E distance are weaker. Variation across a wide range of puff emission rates has relatively weak effects on all three metrics.
