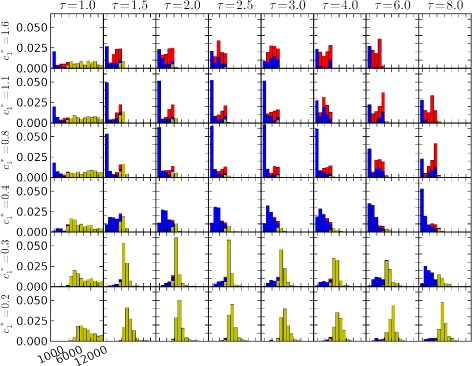
Figure 6.

Tabulated outcomes of simulated male moths seeking a pheromone source: variation with memory timescale, τ, and advance parameter, . The array of graphs represents a matrix, with columns corresponding to memory timescales τ= [1,1.5,2,2.5,3,4,6,8] and rows corresponding to advance parameters . Data comprise 59 replicate plumes (Q=0.125, U gust=0.5, r gust=0.05), with 8 replicated moth trajectories in each plume for each combination of τ and , for a total of 22656 moth trajectories. For all moths, P cross=0.25. Moths were initially 500 nondimensional length units downstream of the source. Simulations were terminated at nondimensional time t=12288. In each plot, the horizontal axis represents distances traveled by simulated moths, and the vertical axis represents frequency of trajectories falling into each of 64 bins regularly spaced between 1000 and 12000. Trajectories outside this interval are not shown. Blue indicates moths that successfully found the source; yellow represents unsuccessful moths that “undershot”, i.e., were found downwind of the source at the end of the simulation; red represents unsuccessful moths that “overshot”, i.e., were found upwind of the source at the end of the simulation. These plots suggest combinations of these two parameters that lead to relatively high plume source location probability, centered roughly along a diagonal line from the upper left to near the lower right of the plot matrix. Source location is much less successful both above and below this line, but for different reasons: Above the line, simulated moths are most likely to have overshot the source. Below the line, moths are most likely to have undershot the source.
