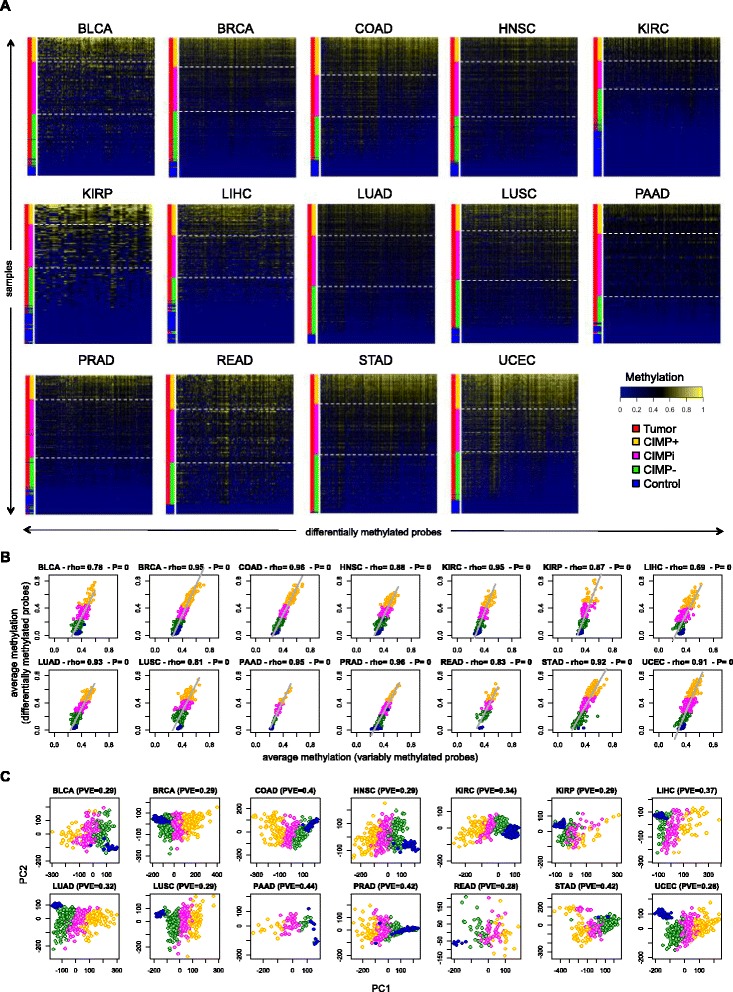
Figure 1.

CIMP+ and CIMP− samples across cancer types. (A) Heat maps showing differentially methylated probes for each individual cancer type. Rows and columns represent samples and selected probes, respectively. Color side bars show tumor vs. control labels, as well as CIMP+, CIMPi, and CIMP− labels resulting from k-means clustering on the vector of average methylation values computed over differentially methylated sites. Rows were ranked from top to bottom in decreasing order of average methylation computed over selected probes. Columns were ordered horizontally using hierarchical correlational clustering. White dashed horizontal lines were used to highlight different subgroups based on CIMP status. (B) Average sample methylation computed over the sets of variably methylated probes (horizontal axes) vs. average sample methylation computed over the set of selected differentially methylated probes (vertical axes). For each plot, we provide the Spearman rho coefficient and the corresponding P-value. (C) PCA results where samples are projected onto the first two principal components. PCA was computed using data for all variably methylated probes within each cancer type. For each plot, we provide the corresponding percentage of variance explained (PVE) by the first two principal components. In panels (B) and (C), each point represents an individual sample and samples are colored according to their CIMP status, using the same color labels as in (A). THCA was excluded from the three panels because no differentially methylated probes had been selected for it.
