
Figure 3.
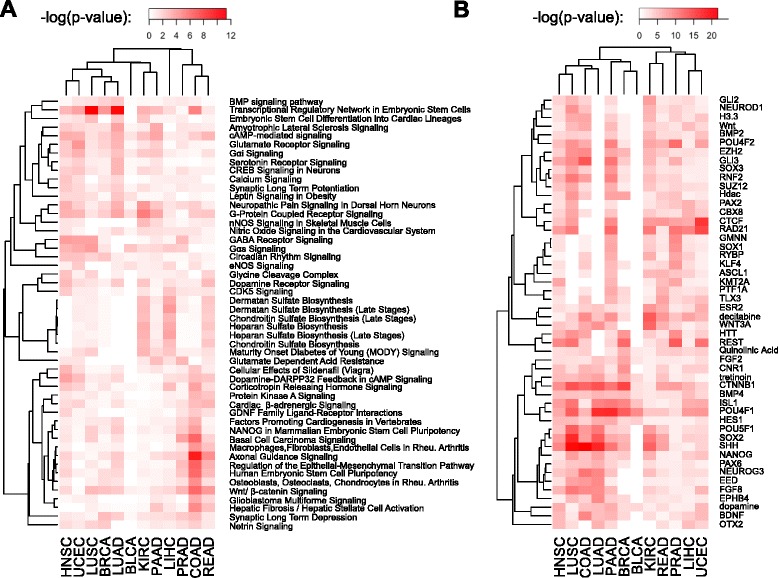
Canonical pathways and upstream regulators associated to selected differentially methylated sites across cancer types. (A) Enrichment of canonical pathways associated to genes that are interrogated by selected differentially methylated probes. (B) Enriched upstream regulators of selected probes. Heat map colors show –log(P-values), so that more intense red color corresponds to higher statistical significance. Each panel shows the top 50 scorers based on Fisher’s sum for combining P-values. Rows correspond to pathways or regulators, while columns correspond to different cancer types. Rows and columns were ordered using hierarchical correlational clustering.