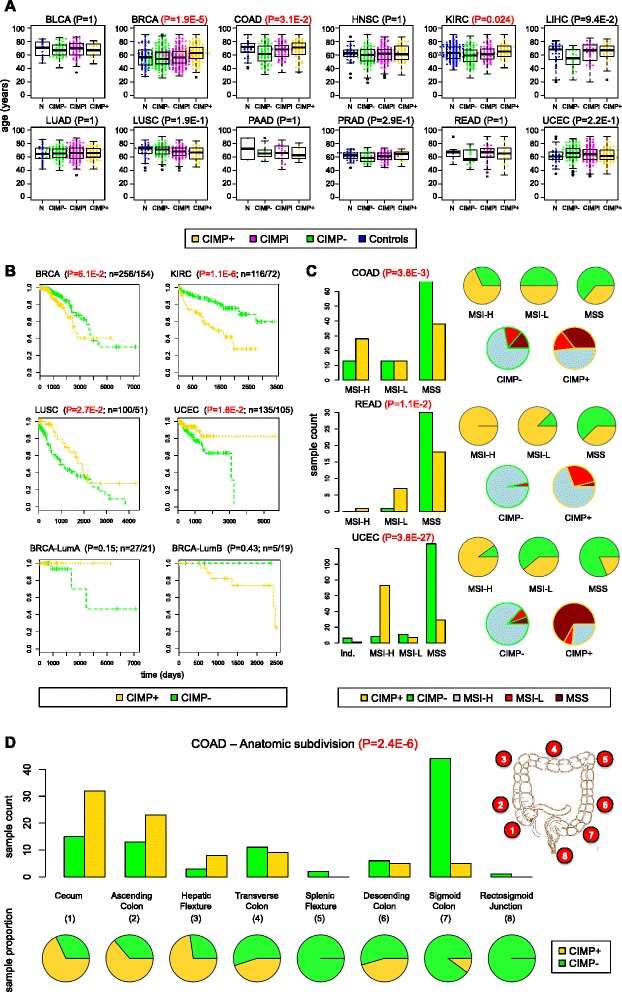
Figure 8.

Associations between CIMP status and clinical annotations. (A) Age vs. CIMP status across 12 cancer types. (B) Overall survival curves for the four cancer types exhibiting significant differences based on CIMP status (BRCA, KIRC, LUSC, UCEC) and overall survival curves for luminal A and luminal B subtypes in BRCA based on CIMP status. (C) Microsatellite instability vs. CIMP status in COAD, READ, and UCEC. (D) CIMP status as a function of anatomic subdivision in COAD. P-values come from a Kruskal-Wallis test for difference in medians in panel (A), a log-rank test for survival curve differences in panel (B), and Fisher’s exact test in panels (C) and (D). For each survival curve in (B), the number of CIMP−/CIMP+ samples is provided next to the corresponding P-value.
