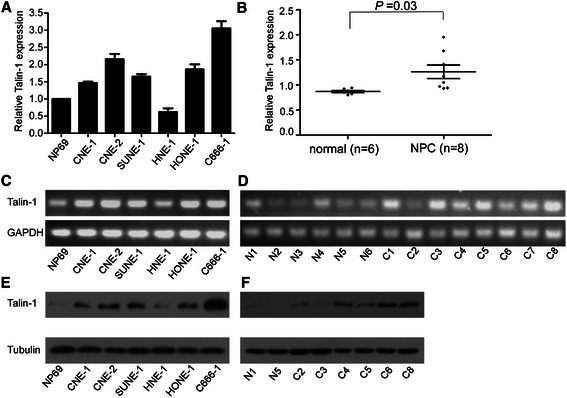
Figure 1.

Talin-1 mRNA and protein expression in NPC cell lines and tissues. (A and B) Quantitative RT-PCR analysis of Talin-1 expression levels in the NP69 and NPC cell lines and in NPC (n = 8) and normal nasopharyngeal epithelial tissues (n = 6). (C and D) Agarose gel electrophoresis of Talin-1 expression in the NP69 and NPC cell lines and in NPC (n = 8) and normal nasopharyngeal epithelial tissues (n = 6). (E and F) Western blotting analysis of Talin-1 protein expression in the NP69 and NPC cell lines and in NPC and normal nasopharyngeal epithelial tissues. Data is presented as mean ± SD values; the P-value was calculated using the Student’s t-test.
