Figure 4.

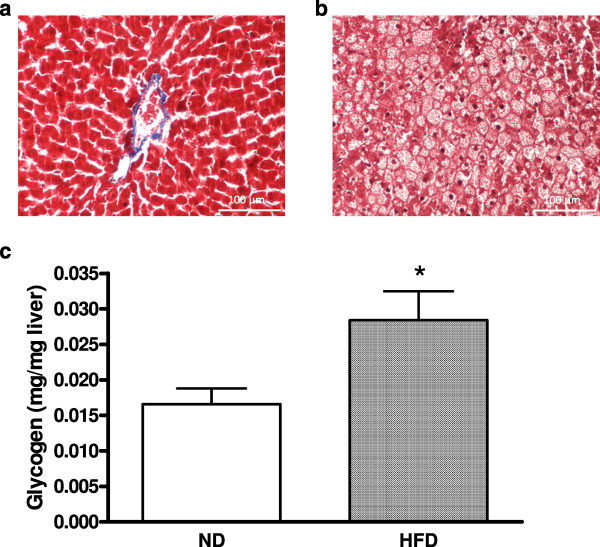
Effect of ND or HFD on the rat liver after 2 months. Tissues were stained with Masson’s trichrome (A and B), and glycogen was extracted from the liver and quantified (C). The data are expressed as the mean ± SEM with five animals per group. *: significant difference in hepatic glycogen between the ND and HFD groups (*: p < 0.05).
