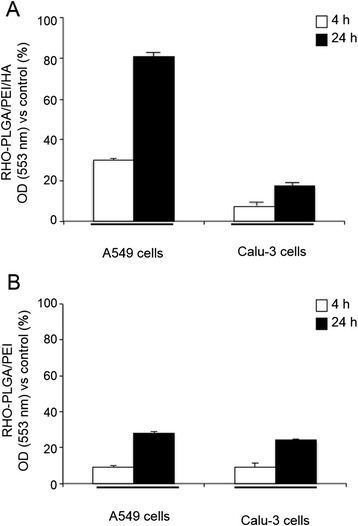
Figure 4.

Cellular uptake of fluorescent NPs. Intracellular levels of fluorescent RHO-PLGA/PEI and RHO-PLGA/PEI/HA NPs. A549 and Calu-3 cells were incubated with 0.5 mg/ml of RHO-PLGA/PEI/HA NPs (A) and RHO-PLGA/PEI NPs (B) for 4 h and 24 h. All measurements were normalized to the fluorescence of RHO-labeled NPs in cell medium set as 100%. Results are presented as percentage (mean ± SEM) (n = 3) of the control cells.
