
Figure 1.
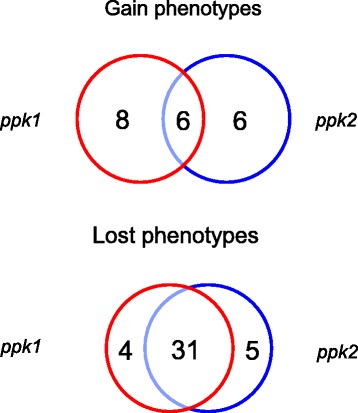
Venn Diagrams derived from the Phenotype MicroArrays results of P. aeruginosa PAO1 polyP synthesis mutants. The numbers indicate the total phenotypes gained or lost for the wild type strain compared with the mutant strains ppk1 (left) and ppk2 (right).