
Figure 11.
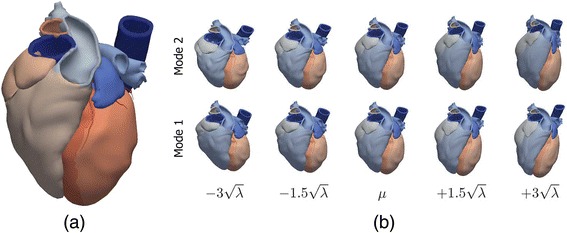
Whole-heart cardiac atlas constructed from in-vivo high-resolution MS-CT of 138 human subjects. (a) Mean shape of the whole-heart atlas. (b) First two modes of variation at end diastole of the spatio-temporal whole-heart statistical atlas (μ represents the mean shape and is the standard deviation). Adapted with permission from [52].