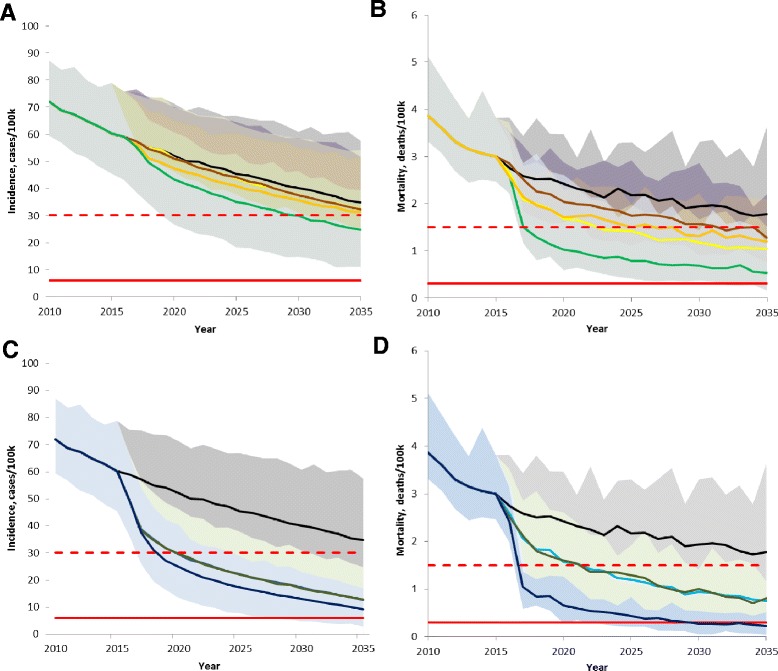
Figure 4.

Impact of interventions on TB incidence and mortality from 2010 to 2035. A, B. None of the feasible interventions, even in combination (bright green), achieve the 2035 incidence or mortality targets. Also shown are the feasible interventions in isolation: baseline (black), expand DOTS (yellow), new drugs (orange), and reduced time to treatment (brown). C, D. Addition of preventative therapy to the feasible interventions (dark blue line) is likely to nearly reach the 2035 targets for both incidence and mortality. Preventative therapy alone (dark green) and active case finding plus preventative therapy (brown) also shown. The 2025 milestone (red dashed line) and 2035 target (red solid line) are calculated from 2015 model estimated mean value. Shaded area represents 95% credible interval including both parameter and stochastic uncertainties.
