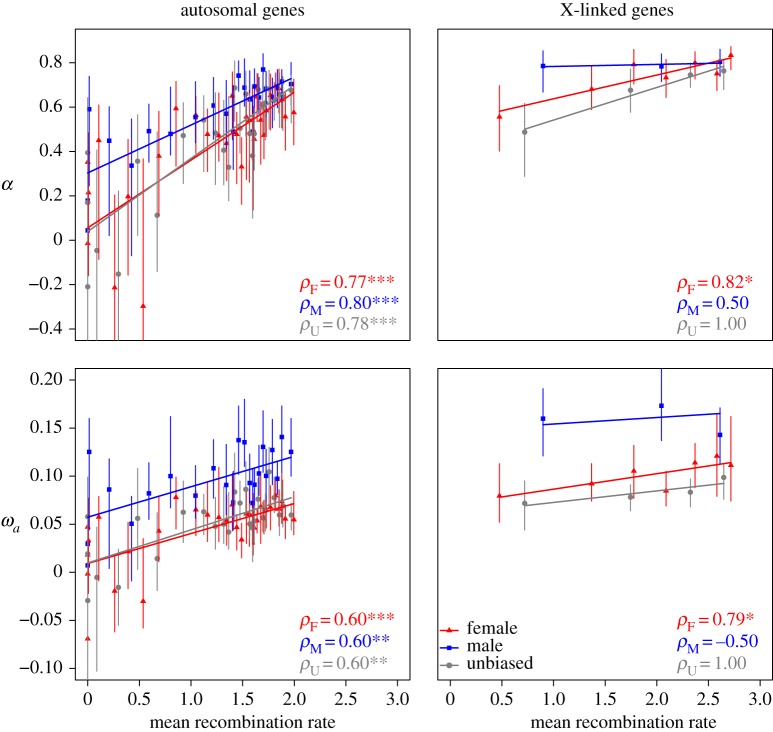
Figure 2.
Plots of α and ωa against the mean effective recombination rates of bins of 80 genes (least-squares regression lines are shown), for female-biased (F), male-biased (M) and unbiased (U) genes. ρ denotes the Spearman's rank correlation coefficients for each expression group. * , ** and *** indicate p values of 0.05, 0.01 and 0.001, respectively.

