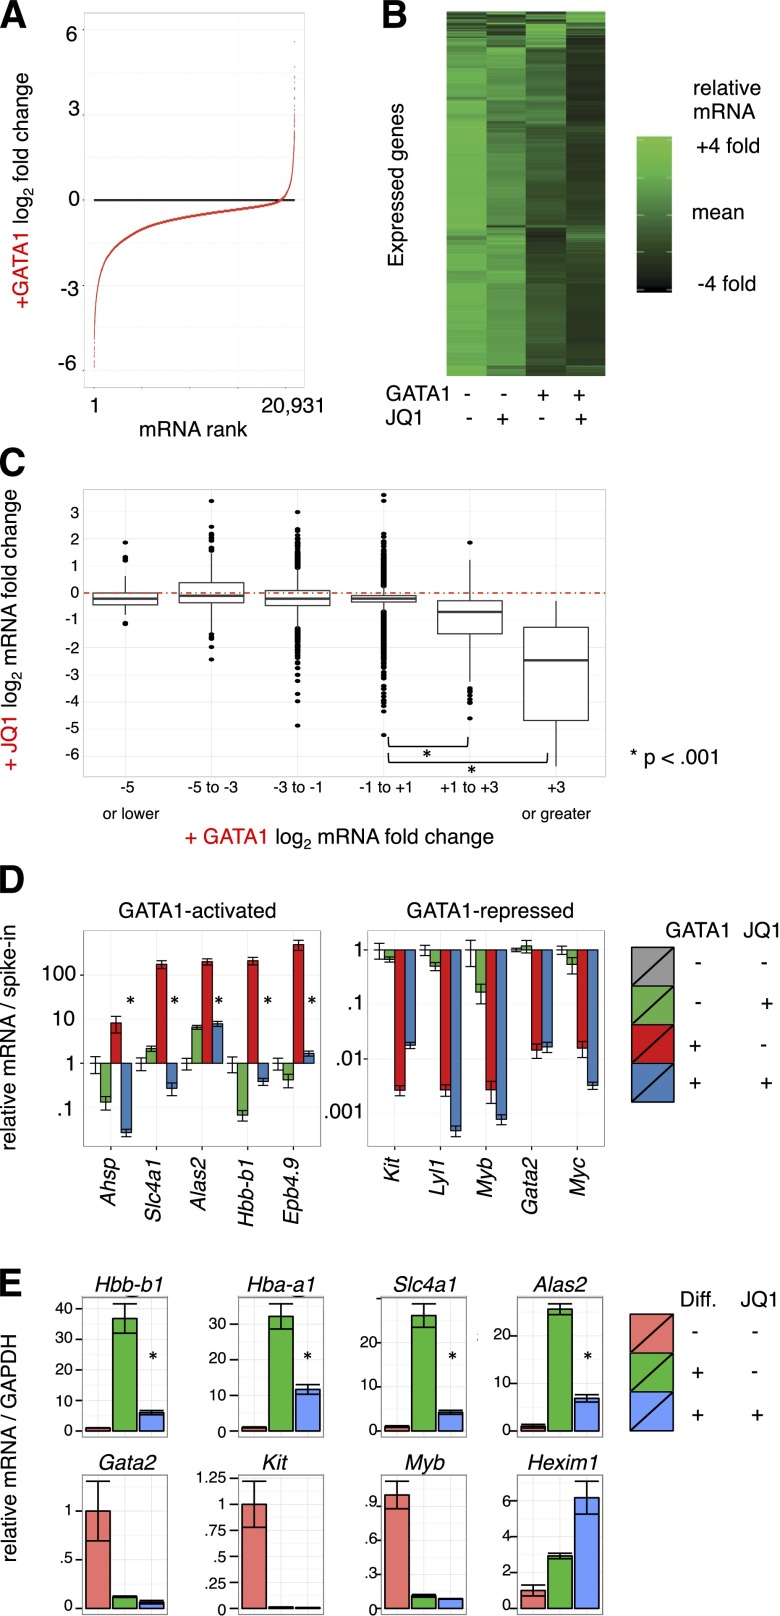
Figure 2.
Transcriptome changes driven by GATA1 activation and BET inhibition. (A-C) Microarray expression profiles of G1E cells ± GATA1 induction in the presence or absence of JQ1. Transcript levels were normalized to cell numbers using external RNA spike-in controls. Data represent the mean of 3 biological experiments. (A) Distribution of mRNA changes upon GATA1 activation. (B) Heatmap showing relative expression of each transcript in each condition. (C) Boxplot showing relationship of activation by GATA1 with JQ1 sensitivity. Red dotted line shows no change in mRNA levels with JQ1 treatment. (D) GATA1-activated and -repressed transcript levels as determined by RT-qPCR. Data were plotted relative to untreated G1E cells normalized to cell number by RNA spike-in controls. *P < .01 (2-sample t test). Error bars represent SEM; n = 3. (E) RT-qPCR for erythroid transcripts in primary fetal liver erythroid progenitors induced to differentiate along the erythroid lineage for 24 hours in the presence or absence of 250 nM JQ1. *P < .01 (2-sample t test). Error bars represent SEM; n = 3. GAPDH, glyceraldehyde-3-phosphate dehydrogenase.

