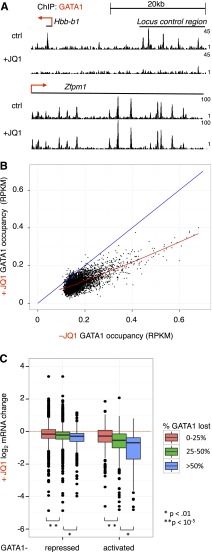
Figure 3.
Effects of BET inhibition on GATA1 occupancy genome-wide. (A) Genome browser tracks showing GATA1 binding at the Hbb and Zfpm1 loci in the absence and presence of 250 nM JQ1. Tracks are from 1 biological experiment and representative of 2 with similar results. (B) GATA1 ChIP-seq read density following GATA1 induction for 24 hours in the absence or presence of JQ1. The red line shows a Loess regression; the blue diagonal demarcates no change between control and JQ1 treatment. (C) Boxplot showing relationship between BET dependence of GATA1 occupancy and transcriptional activation. GATA1 peaks are linked to nearest gene within 5 kb. P values reflect results of 2-sample t tests from indicated comparisons.

