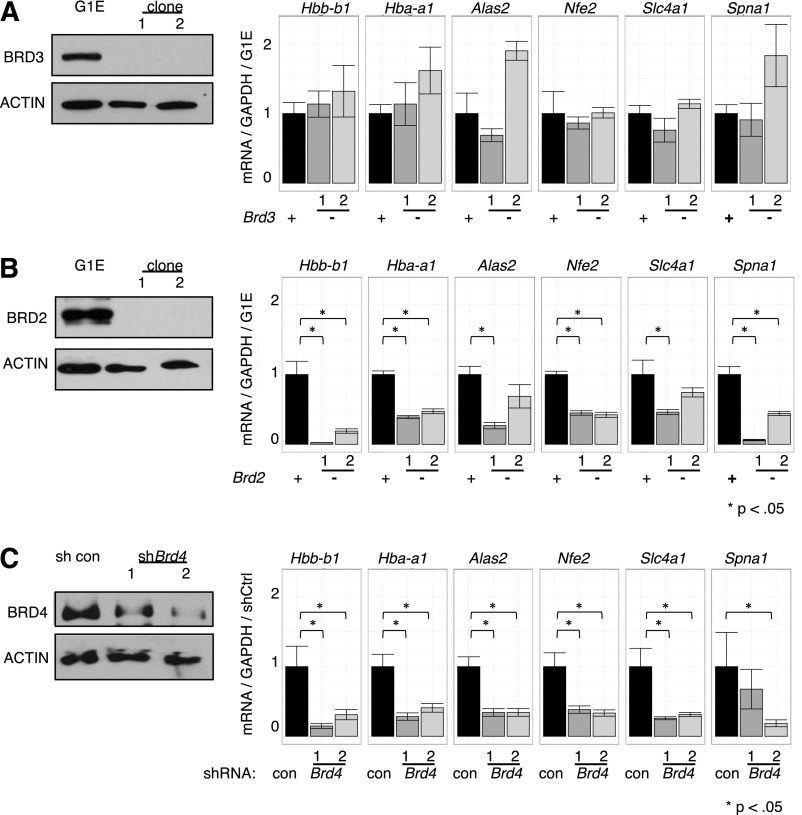
Figure 5.
Functions of individual BETs in GATA1-activated transcription. (A-C) Left, Western blots with antibodies against indicated BET proteins. Right, Relative transcript levels following GATA1 activation in cells depleted of (A) BRD3, (B) BRD2, or (C) BRD4. BRD4 reduction was achieved by shRNA-mediated Brd4 knockdown. P-value comparisons are the results of 2-sample t tests.

