Figure 3.
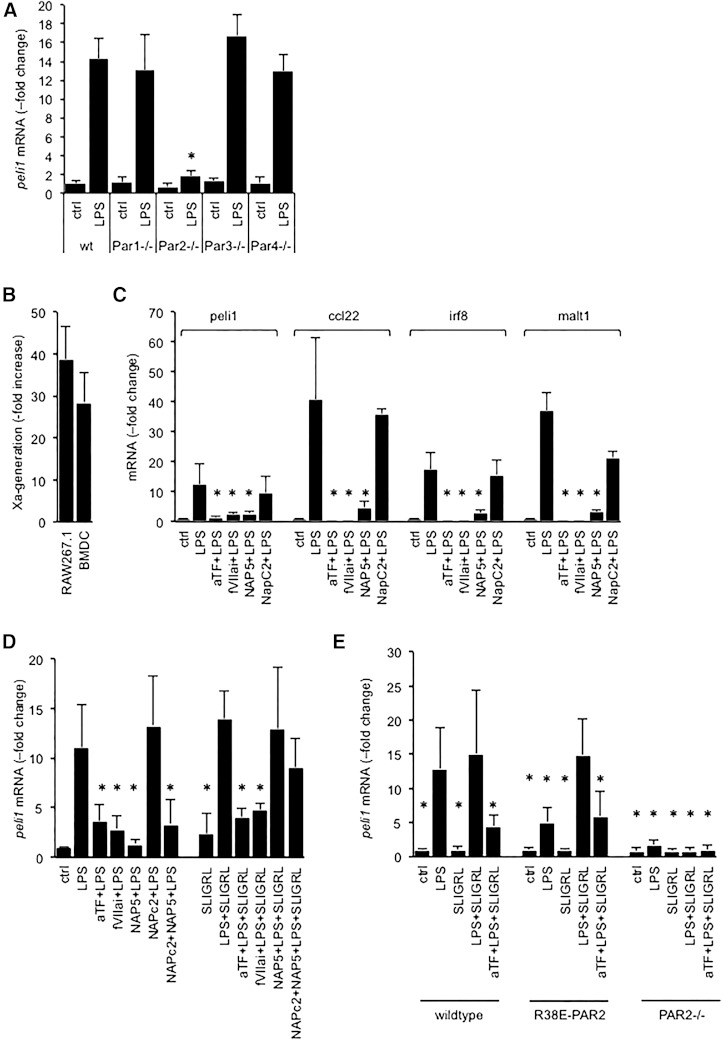
Biomarker induction by LPS is due to PAR2 activation by the TF-VIIa-Xa complex. (A) Peli1 mRNA abundance relative to 18S rRNA in LPS-treated BMDCs prepared from wild-type (wt) mice and mice lacking the indicated PAR. Data are expressed as the fold increase over baseline levels in wild-type cells and represent the average ± standard deviation of 4 culture experiments with triplicate measurements per sample. *P < .01 for LPS-treated samples in comparison with wild-type cells via Student t test. Corresponding data for Irf8, Ccl22, and Malt1 are shown in supplemental Figure 3. (B) Tissue factor activity in BMDC and RAW cells was measured via the rate of FXa generation in a 2-stage amidolytic assay for FXa activity at baseline and after 3 hours of exposure to LPS. Data are expressed as the fold increase over baseline levels (no LPS) corrected for background activity (no FVII) and represent the average ± standard deviation of 6 independent experiments. (C-D) RAW cells or wild-type BMDCs were incubated for 3 hours with LPS (100 ng/mL), the indicated reagents (α-TF: anti-murine tissue factor antibody: 5 μg/mL; active-site blocked FVIIai, Nap5, NapC2: 500 nM; SLIGRL: 20 μM), and biomarker mRNA relative to 18S rRNA was quantitated by PCR. Data are expressed as the fold increase over no-LPS controls and represent the average ± standard deviation from 4 independent experiments. *P < .05 by comparison with cells treated with LPS alone (Student 2-tailed t test). (E) Peli1 mRNA regulation by LPS in BMDCs prepared from wild-type mice, a knock-in mouse strain expressing the cleavage resistant R38E-PAR2 variant, and PAR2-knockout mice (PAR2−/−). Data are the average ± standard deviation from 3 independent experiments. *P < .05 by Student 2-tailed t test as compared with LPS-treated wild-type cells.

