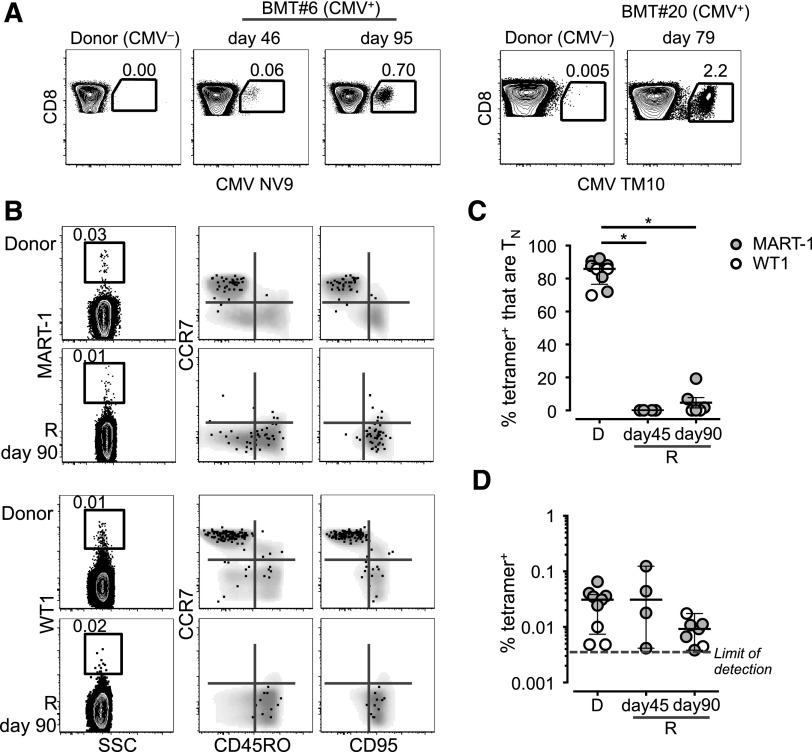
Figure 4.
Persistence and memory differentiation of antigen-specific TN. (A) Frequency of CD8+ T cells in PBMCs from 2 CMV− donors and matched CMV+ recipients at different time points post–haplo-HSCT. (B) Frequency and phenotype of MART-1– and WT1-specific CD8+ T cells identified by MHC class I tetramers. Tetramer+ T cells are overlaid on top of the total CD8+ T-cell population depicted in gray. In panels A and B, numbers indicate the percentage of cells identified by the gates. (C) Frequency of MART-1+ (filled gray circles) and WT1+ (blank circles) CD8+ T cells with a TN-cell phenotype in donors (D) and recipients (R) at day 45 and day 90 post–haplo-HSCT. P < .05, Mann-Whitney test. (D) Mean ± SEM frequency of the cells identified in panel B.

