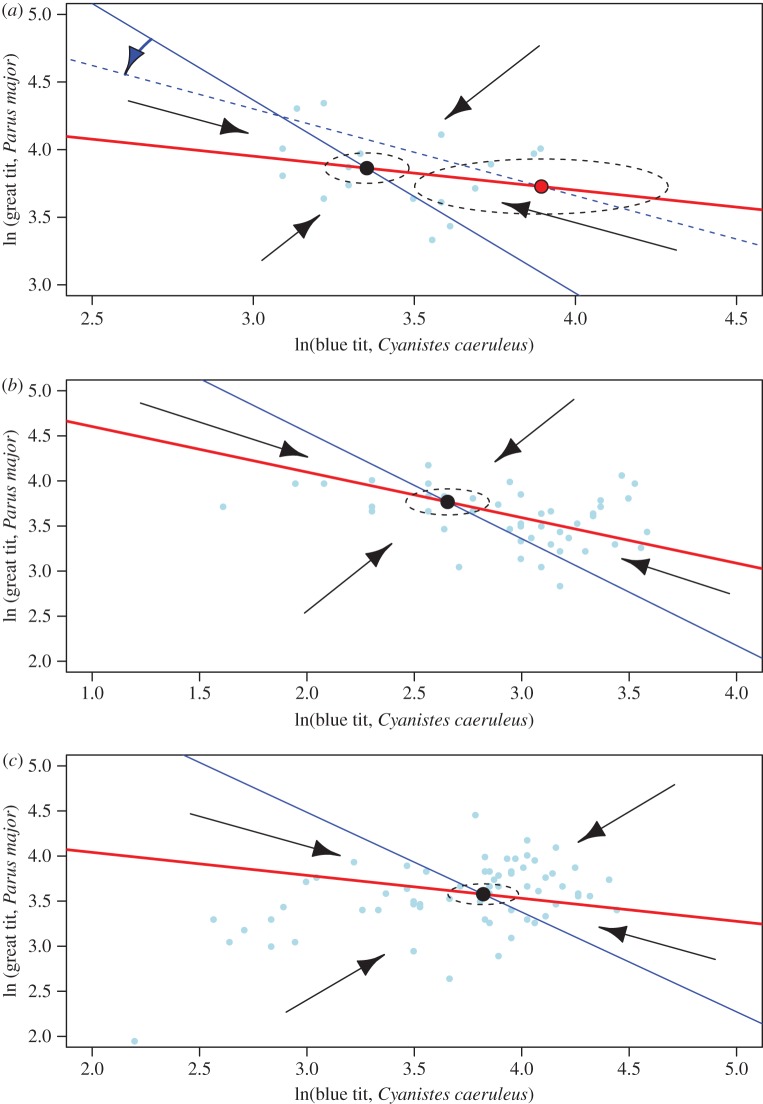
Figure 2.
Zero-growth isoclines for sympatric populations of GTs (bold red lines) and BTs (blue lines). Big black dots show estimated stable equilibrium points (ln(N*) in table 1) and small light blue dots show the census data. The dotted ellipses correspond to the standard deviation around the equilibrium calculated by bootstrap methods (electronic supplementary material, table S6). α is αij. In Plot B, BT population shows a threshold interaction with an environmental variable (mean temperature conditions in spring; (a)). For BT, there is a different isocline (and equilibrium state) for temperatures below (blue line) and above (blue dotted line) the threshold of mean spring temperature of 9.7°C. The blue curved arrow indicates the direction of the change of the BT isocline with an increase of temperature over the threshold and the big red dot the corresponding new equilibrium point. In Plot HP, the equilibrium is unaffected by the environmental variables modelled (b). At Marley Wood, the community equilibrium point is unaffected by the environmental variables modelled (c). (Online version in colour.)

