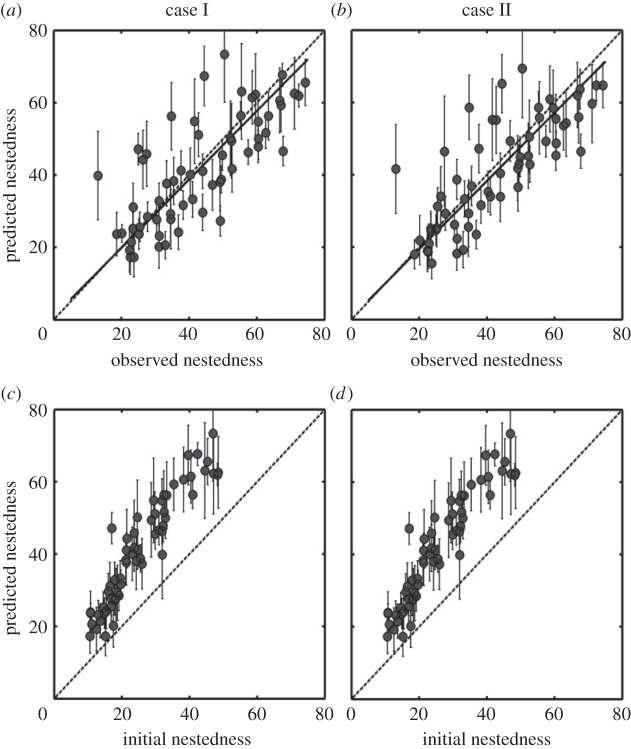
Figure 3.
Observed, initial and predicted nestedness for 28 plant–herbivore and 33 host–parasite networks. (a,b) Observations versus predictions from different model parameters (Cases I and II in the electronic supplementary material, figure S1). (c,d) The comparison between these two nestedness predictions and the initial random matrices at the beginning of each simulation. Predictions are the averages of the last 200 time units after the dynamics stabilizes. Error bars indicate double standard deviation. Solid lines are results from the reduced major axis regression (Case I: slope = 0.95, r2 = 0.58, t = −0.977, p = 0.333; Case II: slope = 0.94, r2 = 0.64, t = −1.458, p = 0.15; and the dashed lines indicate perfect agreement between predictions and observations (y = x).

