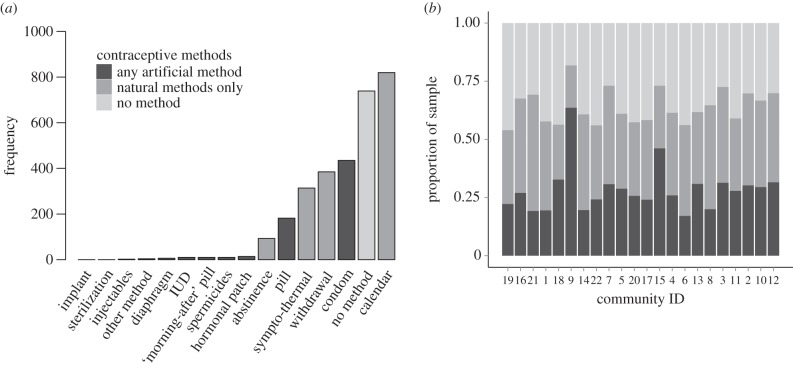
Figure 1.
Frequency distributions of (a) contraceptives ever used by women in the sample (n = 1972) and (b) proportion of women using the different method types. Bars in (b) are ordered in terms of increasing population density from left to right. Community IDs give the order in which the communities were sampled.

