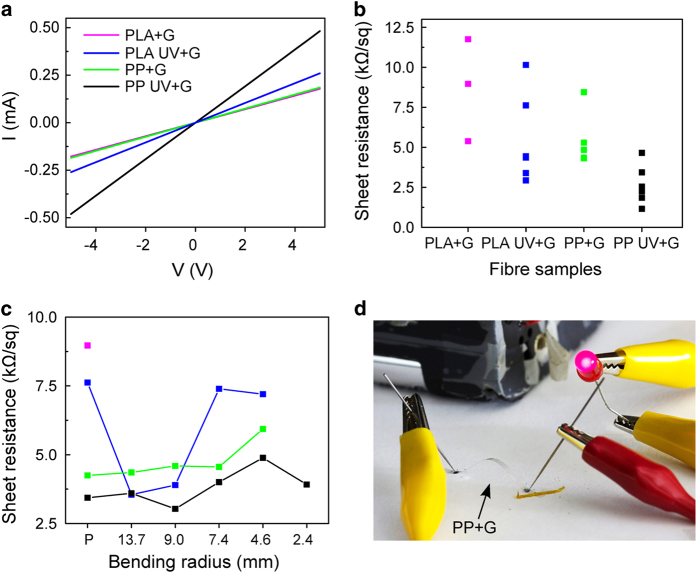
Figure 3. Sheet resistivity of the conducting fibers.
(a) I-V curve of PP fiber with graphene (PP + G, green), PLA fiber with graphene (PLA + G, magenta), and the corresponding UV treated fibers with the graphene, PP UV + G (black) and PLA UV (blue). (b) Sheet resistivity of the samples. (c) Evolution of the calculated sheet resistivity of the samples with increasing bending. The PLA + G sample lost integrity with bending, while the other samples responded with a slight increase in sheet resistivity. (d) Photograph of an electric circuit with a LED light, closed with a bent and suspended transparent PP fiber coated with graphene. The visible graphite contacts were only used to define the channel length.

