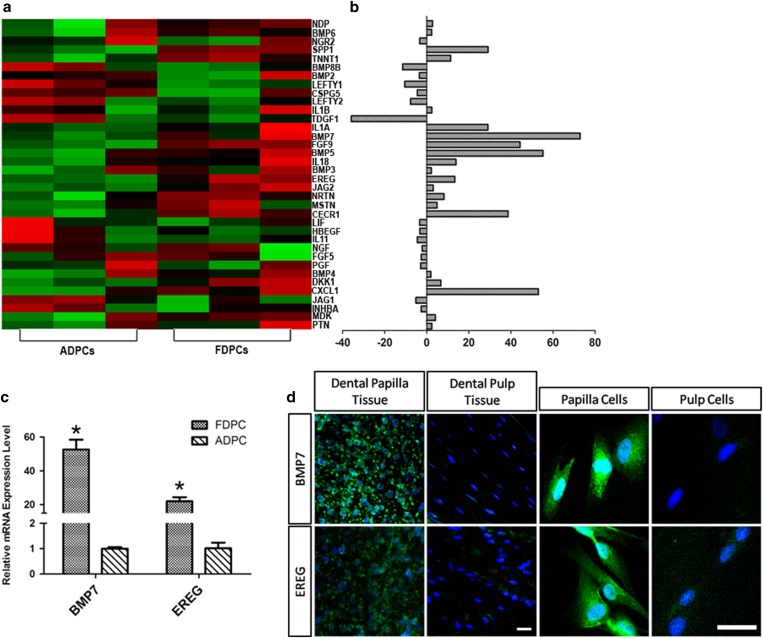
Figure 2. Growth factors were differentially expressed in FDPCs and ADPCs.
(a) Heat map of differentially expressed (2.0-fold) growth factors between ADPCs and FDPCs (p < 0.05). (b) Bar graph showing the fold changes. (c) qPCR validation confirmed the differential expression levels of BMP7 and EREG between FDPCs and ADPCs. (d) BMP7 and EREG protein expression levels differed between dental papilla and adult dental pulp cells. *p < 0.01.

