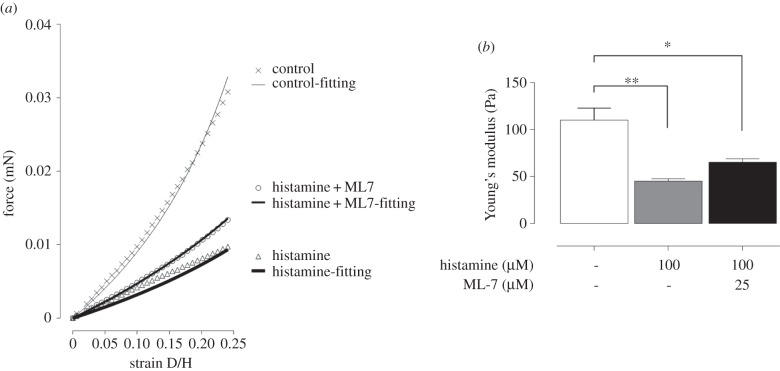
Figure 3.
(a) Typical Young's modulus fitting of collagen gel contraction measurement from force–strain curve. (b) Data denote mean±s.e.m. of Young's modulus of collagen gel with/without histamine and ML-7. P-value was calculated using one-way ANOVA with Bonferroni post hoc test. **p < 0.05; *p < 0.5.

