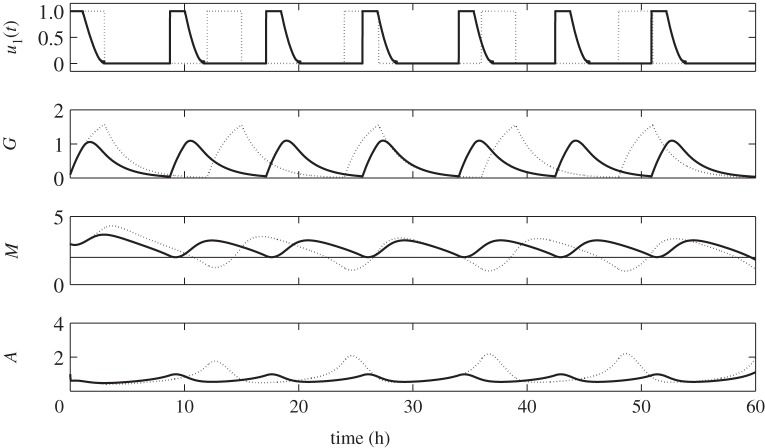
Figure 3.
Time course of regular control (dotted) and optimal control (solid) with its corresponding glucose (G), miR-451 (M) and AMPK complex (A) concentration levels. The optimal control scheme maintains the anti-invasive phase (high miR-451, low AMPK) while that with regular control leads to the dangerous migratory phase (M < thM).

