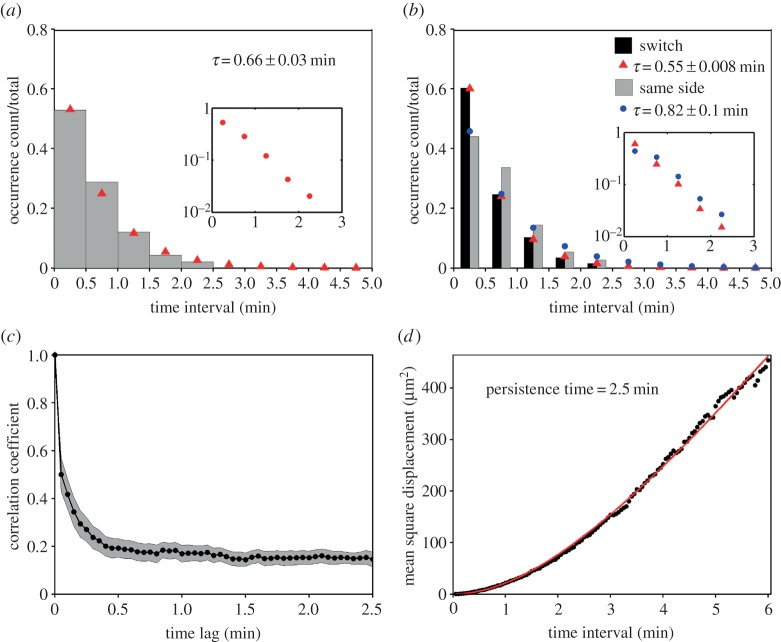
Figure 3.
Lamellipodial bifurcation is rapid compared with cell movement. (a) Normalized waiting-time distribution (WTD) for pairs of consecutive bifurcation events (n = 488). The red symbols are the corresponding best-fit values assuming an exponential distribution. The inset shows the semi-logarithmic plot of the same dataset. (b) WTDs for bifurcation pairs where the two dominant protrusions were on different sides of the migration axis (switch; n = 264) or on the same side (n = 224). The corresponding exponential fit values are indicated by red and blue symbols, respectively. The inset shows the semi-logarithmic plots of the switch (red) and same-side (blue) data. (c) The autocorrelation coefficient of the cell movement vector as a function of the time lag. The grey region indicates the 95% confidence interval. (d) Mean-squared displacement as a function of time interval. The red line is the best fit to a persistent random walk model.

