Figure 4.
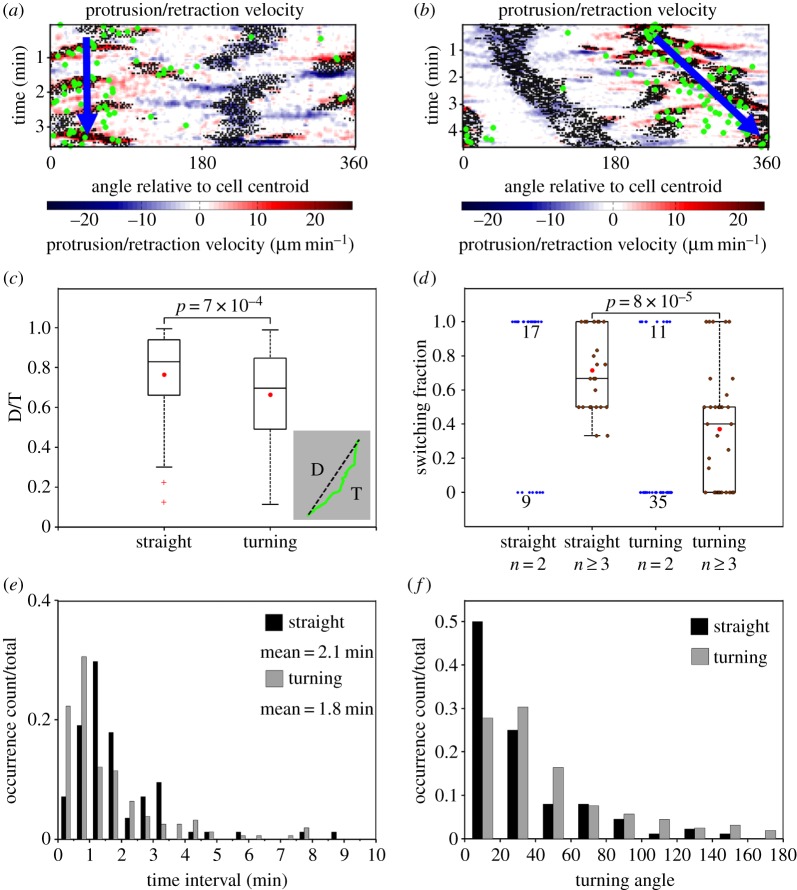
Persistent and turning migration modes are associated with switching and same-side bifurcations. (a,b) Morphodynamic maps of representative straight (a) and turning (b) migration periods. Green dots indicate the cell centroid track. (c) Distributions of displacement-over-distance travelled (D/T) ratio for straight (n = 84) and turning (n = 157) periods. Each box and whiskers indicates the quartiles of the distribution; red dots: mean values. p-value: Student's t-test. (d) Distributions of bifurcation switching fraction for straight and turning periods. The switching fraction is defined as the fraction of consecutive bifurcation pairs that switch sides of the migration axis (left–right and right–left). Each box and whiskers indicates the quartiles of the distribution of periods with at least two bifurcation pairs (n ≥ 3). The blue dots are switching fractions for periods with only one bifurcation pair (n = 2); the numbers indicate the number of occurrences when the switching fraction was 0 or 1. Red dots: mean values. p-value: Student's t-test. (e) Normalized distributions of time duration for straight and turning periods. (f) Normalized distributions of absolute turning angle associated with the change in overall direction of migration between consecutive bifurcations, as observed during straight and turning periods with at least one bifurcation pair.

