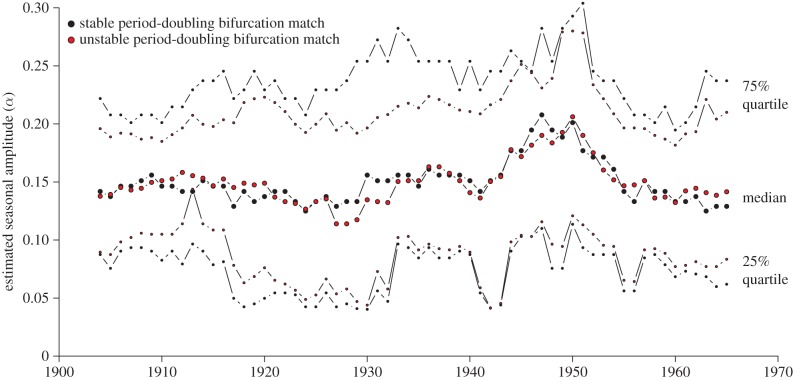
Figure 4.
Estimates of the amplitude (α) of seasonality of measles transmission, from 1904 to 1965, based on 9-year time windows around each year (details in §3.2.2). The measles incidence data after 1970 (after mass vaccination was in full force) is much noisier and estimating α is much more difficult. We assume α remained roughly constant after the final point shown in the graph. (Online version in colour.)

