
Figure 8.
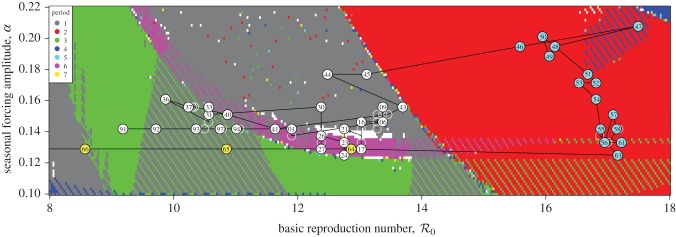
Zoomed-in and enhanced version of the boxed region in figure 7. The estimated yearly parameter time series  is overlaid on the colour-coded attractor plot. Different epochs have been marked with different coloured circles; 1891–1945 white, 1946–1963 teal and 1964–1984 yellow. The number in each circle is the last two digits of year t for t in the range 1891–1984 (some years are marked with white circles and no year for readability). Where more than one resonant period is possible (depending on initial conditions), coexistence of multiple attractors is shown with alternating stripes.