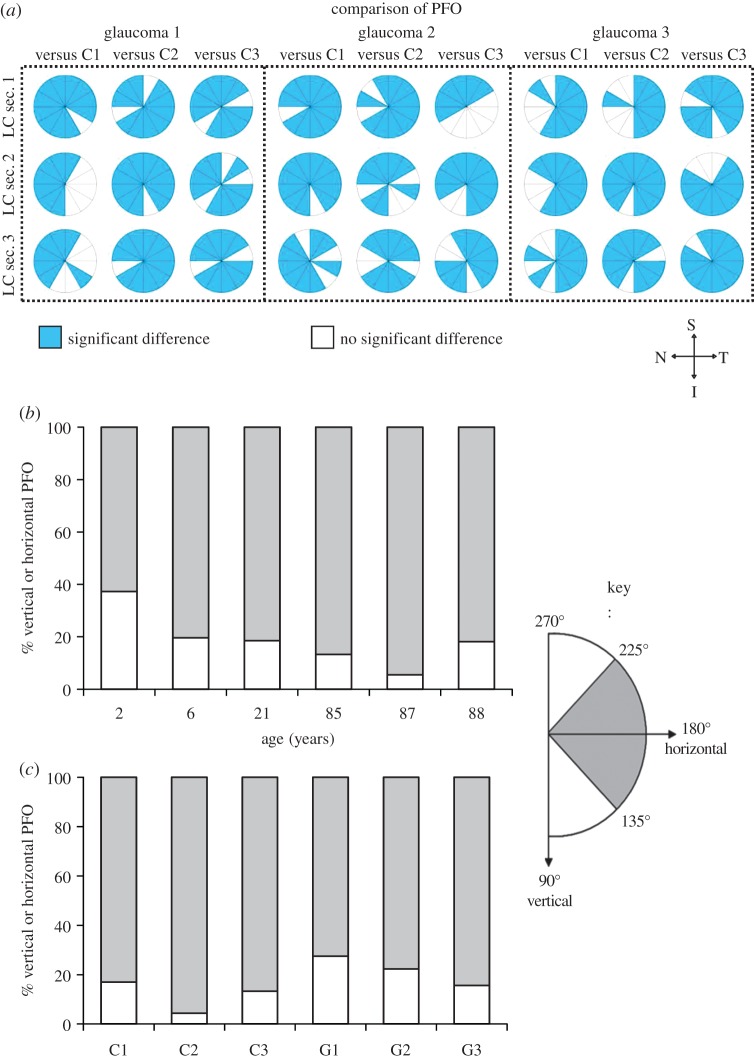
Figure 7.
(a) Significant differences in PFO distributions (determined using the Mardia–Watson–Wheeler test; p < 0.017), denoted in blue, were identified in many of the 12 LC regions analysed in each of the three LC sections (anteriormost LC sec. 1 to LC sec. 3) between three glaucoma (G1, G2, G3) and three age-matched control (C1, C2, C3) LCs. Orientation of LC sections is shown; S, superior; N, nasal; I, inferior; T, temporal. (b) Percentage occurrence of temporal–nasal, i.e. horizontal (angles 135°–225°; grey bars), and superior–inferior, i.e. vertical (angles 90°–135° and 225°–270°; white bars), PFOs in an age range of LCs and (c) in PFOs in transverse sections through the LC of control (C1, C2, C3) and glaucoma (G1, G2, G3) ONHs. In all LCs, a horizontal fibre orientation predominated. Angle range is provided in key.

