Figure 2.
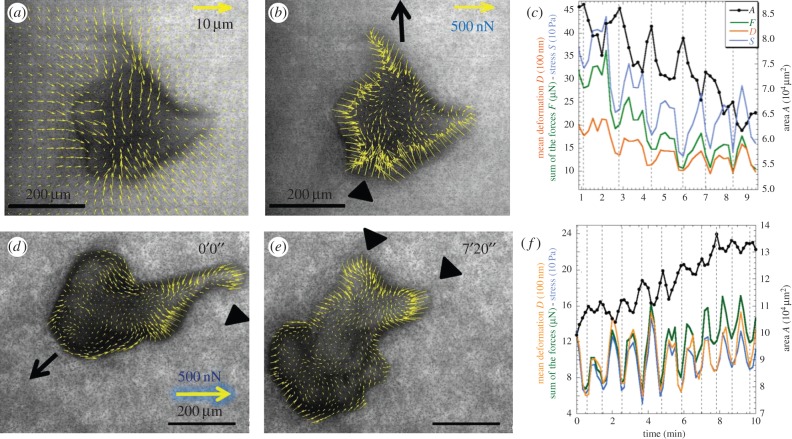
Deformation and force field of two amoeboid type microplasmodia. (a) PIV deformation field and (b) corresponding force field of a first amoeboid microplasmodium slowly moving towards the top (arrow in b). (d,e) Force field at 0 and 7 min 20 s of another amoeboid microplasmodium moving quickly towards bottom left (arrow in d) and experiencing large shape changes. Forces are very peripheral almost absent from the inner region, always directed centripetally (inwardly) and maximum in the rear parts (arrowheads). (c,f) For each microplasmodium, the sum of the forces F (in micronewtons, green line), the mean bead deformation D (in units of 100 nm, orange line) and the stress S (in units of 10 Pa, blue line) oscillate in phase opposition with the oscillations of area A (in units of 104 µm2, black line). Vertical dotted lines corresponding to peaks of cell area (i.e. maxima). The mean interval between lines (i.e. period of contraction–relaxation cycles) is T = 1.6 min in (c), T = 1 min in (f).

