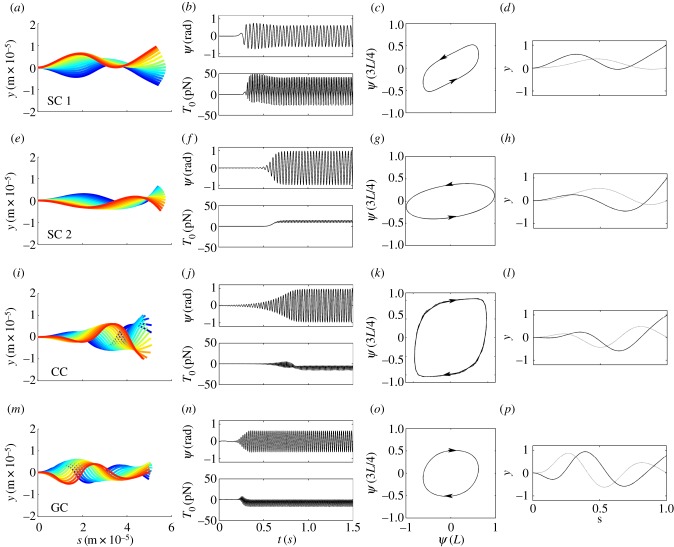
Figure 13.
Results from simulation of the full nonlinear equations of each model. (Column 1) Successive snapshots of the flagellar waveform from time-marching simulations; colour shows time increasing from blue (early) to red (later); (column 2, top) time series of angle ψ(L)at s = L; (column 2, bottom) flagellar tension T0 at the base s = 0. Note that a mean value of T0 < 0 indicates axial compression of the flagellum, corresponding to pushing on the base and propulsive behaviour. (Column 3) Plot of ψ(3L/4) versus ψ(L) (clockwise loop = anterograde propagation; counter-clockwise = retrograde); (column 4) fundamental mode from Fourier analysis of simulation. Table 5 lists the relative contribution of each such mode and its correlation with unstable modes of the linearized version. (row 1, a–d, SC 1): sliding-controlled model with sliding at the base (reference [22]; parameters in table 1); oscillation frequency: 27.3 Hz. (Row 2, e–h, SC 2): sliding-controlled model, with no sliding at the base (reference [23]; parameters in table 2); frequency 31.3 Hz. (Row 3, i–l, CC): curvature-controlled model (reference [17]; parameters in table 3); frequency 37.8 Hz. (Row 4, m–p, GC): GC model (reference [28]; parameters in table 4); frequency 46.2 Hz. All models used the same basic physical parameters: length L = 58 µm, flexural rigidity EI = 1700 pN-µm2, diameter a = 185 nm and resistive force coefficient cN = 0.0034 pN-s µm−2.

