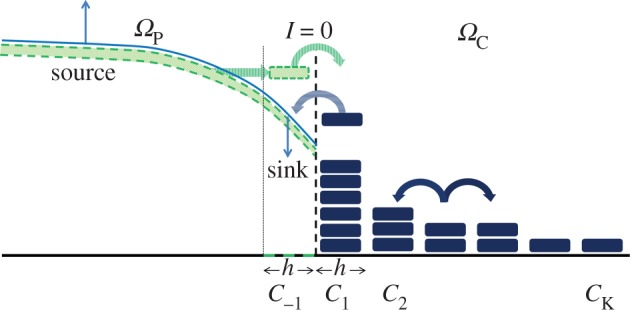
Figure 2.

A cartoon schematic illustrates the most important features of algorithm 1 in one dimension. In ΩC, to the right of the interface, particles are represented as individuals in compartments (dark blue rectangles) with each individual adding 1/h to the density in that compartment. Particles can jump to neighbouring compartments within ΩC (dark blue block arrows). In ΩP, to the left of the interface, density is represented by a ‘continuous’ function (light blue curve). Particles in the left-most compartment in ΩC (adjacent to the interface) can jump into the PDE regime (blue horizontally striped arrow) where they are added by means of an indicator function to the PDE solution in the region [−h,0)—the pseudo-compartment. The PDE does not include information about the specific location of individuals and, so when a particle jumps from the pseudo-compartment into ΩC, it must first be realized in the pseudo-compartment by subtraction of its contribution to the whole PDE followed by an instantaneous jump over the interface. Every instance in which a particle does not jump from the pseudo-compartment into ΩC, the conditional probability to find particles in the distribution must necessarily be adjusted, so that more weight lies outside of the pseudo-compartment. This effect results in a net source of distribution outside of the pseudo-compartment in the PDE and a balancing net sink of distribution inside the pseudo-compartment such that the total number of particles is conserved in the absence of reactions. (Online version in colour.)
