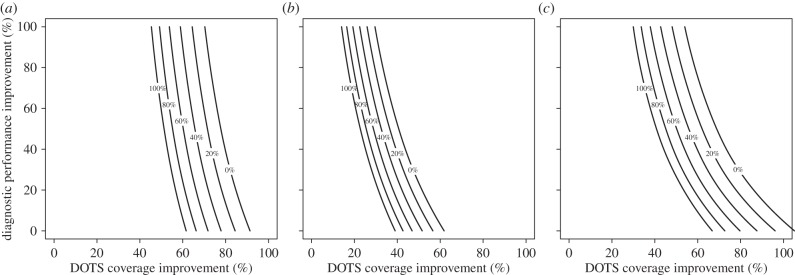
Figure 3.

Isocline plots of the TB interventions needed to match ART expansion on (a) cumulative 5-year incidence, (b) cumulative 20-year incidence and (c) cumulative 5-year mortality. The axes represent the percentage improvement in DOTS coverage and diagnostic performance and the lines are labelled with the percentage improvement in clinical performance needed to achieve the same outcome as ART expansion. On every dimension, 0% corresponds to the baseline level and 100% to the maximum attainable level of improvement.
