Figure 5.

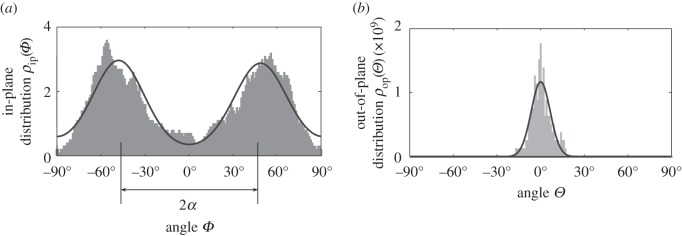
(a) Probability density ρip(Φ + α), ρip(Φ − α) plotted against Φ with the concentration parameter a = 2.54 and with two mean fibre directions located at α =±47.99° and (b) probability density ρop(Θ) against Θ with the parameter b = 19.44.

(a) Probability density ρip(Φ + α), ρip(Φ − α) plotted against Φ with the concentration parameter a = 2.54 and with two mean fibre directions located at α =±47.99° and (b) probability density ρop(Θ) against Θ with the parameter b = 19.44.