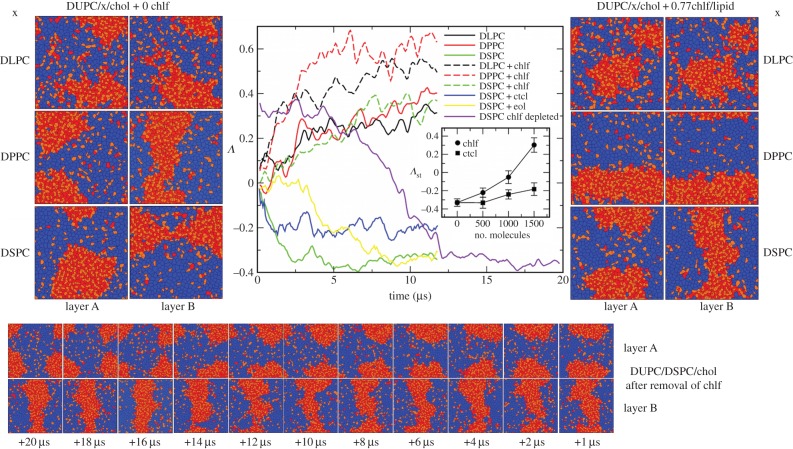
Figure 2.
(Left) Final snapshots of each leaflet of the simulated DUPC/x/chol membrane systems in the absence of chlf. First row, x = DLPC. Second row, x = DPPC. Third row, x = DSPC. Voronoi polygons are filled with a colour that identifies each of the lipid components: DUPC (blue), saturated lipid × (red) and chol (orange). (Centre) Temporal evolution of the interleaflet coupling parameter Λ. DUPC/x/chol membranes where x = DLPC (black), DPPC (red), DSPC (green). Solid lines correspond to chlf-free systems and dashed lines stand for bilayers with 0.77 chlf per lipid. Blue and yellow correspond to the DUPC/DPSC/chol bilayer with 0.77 ctcl and 0.77 eol molecules per lipid, respectively. The violet line stands for the evolution of the final configuration of the DUPC/DSPC/chol + 0.77chlf per lipid system once the chlf molecules were removed. Inset: stationary value for the coupling parameter Λst (averaged over the last 4 μs) at different chlf and ctcl contents for the DUPC/DSPC/chol system. (Right) Final snapshots of each leaflet of the simulated DUPC/x/chol membrane systems in the presence of 0.77 chlf molecules per lipid. (Bottom) Temporal evolution (from right to left) of each leaflet of the final DUPC/DSPC/chol + 0.77chlf/lipid membrane system once chlf molecules are removed (violet line in the central panel).

